3D Print Calculator Web / Getting started
Reference / explanationUnderstand costs, profit margin, ROI and payback
Version 1.4 · Updated · View changes
Learn the calculator’s key formulas, compare margin with markup, and work through cost and investment examples.
Screenshots use sample data. Your prices, license level and settings may differ.
When to use this reference
Use these formulas to understand the web calculator’s estimates and the financial charts in Reports.
Key concepts
- Start with per-piece costs. Combine repeatable costs with the expected cost of failures, then add the chosen one-time allocation.
- Choose a target margin to calculate selling price. Margin and markup use different denominators; compare the formulas below.
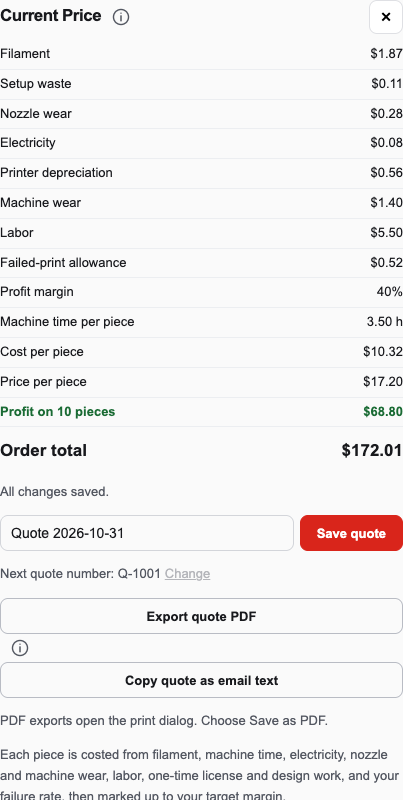
Use the separate cost, selling-price and profit rows when applying the margin formulas below. Open full size - Read the whole-quote total and profit separately from the unit values. Order rounding can change the actual margin.
- For Reports, start with the initial investment and follow monthly cash. Depreciation changes book value but is not a second cash payment.
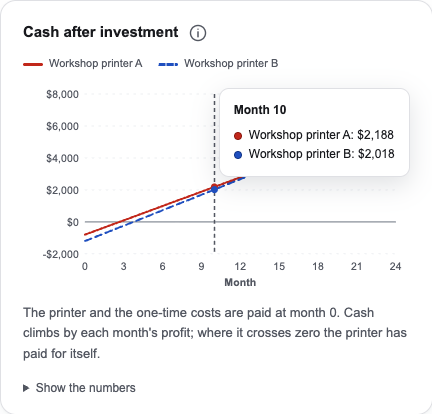
The cash chart starts below zero. The zero crossing marks payback; positive cash after that produces positive ROI. Open full size
How to interpret the result
Use the same units and currency throughout. Profit margin is a share of revenue; ROI compares cumulative cash after initial investment with that initial investment.
Limits and assumptions
- Examples simplify the numbers and do not change the current quote.
- Reports is arithmetic on your assumptions. It does not model tax, financing or replacement printers.
- A displayed amount is rounded for readability; the calculation can retain more precision.
Related help
Use the margin and report guides for the app controls. If a result still differs from your expectations, create a support ticket with the entered values.
Formulas and worked examples
All amounts must use the same currency. Convert percentages to fractions when a formula uses a rate: 40% = 0.40.
Costs
Filament cost
Cost per gram = Spool price ÷ Spool weight
Material cost = Grams used × Cost per gram
TeX source
c_g=\frac{P_{\mathrm{spool}}}{W_{\mathrm{spool}}} \\ C_{\mathrm{material}}=g\,c_gWorked example: A $22 spool weighing 1,000 g costs $0.022/g. Using 85 g costs $1.87.
Enter consumption for one piece. The app adds the active filaments together; setup waste and nozzle wear are separate cost rows.
Live Excel example · edit inputs and see results
Blue cells are editable. Results recalculate as you type. Each example is a separate sheet; percentages entered as inputs use whole numbers, such as 40 for 40%.
| A · Description | B · Value / result | Excel formula in B | |
|---|---|---|---|
| 1 | Spool price ($) | Editable input | |
| 2 | Spool weight (g) | Editable input | |
| 3 | Grams per piece | Editable input | |
| 4 | Cost per gram ($) | =IFERROR(B1/B2,"Not defined") | |
| 5 | Material cost ($) | =B3*B4 |
Use these examples to learn the formula. They do not change your saved quote. Division by zero shows a message instead of a misleading number.
Electricity
Electricity cost = (Printer watts ÷ 1,000) × Machine hours × Price per kWh
TeX source
C_{\mathrm{electricity}}=\frac{W}{1000}\,t\,r_{\mathrm{kWh}}Worked example: 150 W ÷ 1,000 × 4 h × $0.20/kWh = $0.12.
Machine hours include prep and filament-change time unless the slicer already includes the changes.
Live Excel example · edit inputs and see results
Blue cells are editable. Results recalculate as you type. Each example is a separate sheet; percentages entered as inputs use whole numbers, such as 40 for 40%.
| A · Description | B · Value / result | Excel formula in B | |
|---|---|---|---|
| 1 | Printer watts | Editable input | |
| 2 | Machine hours | Editable input | |
| 3 | Price per kWh ($) | Editable input | |
| 4 | Electricity cost ($) | =(B1/1000)*B2*B3 |
Use these examples to learn the formula. They do not change your saved quote. Division by zero shows a message instead of a misleading number.
Hands-on labor
Labor cost = Hands-on hours × Hourly labor rate
TeX source
C_{\mathrm{labor}}=\frac{m_{\mathrm{hands\!\!\!-on}}}{60}\,r_{\mathrm{hour}}Worked example: 15 minutes ÷ 60 × $24/hour = $6.00.
The app includes the attention time for entered pauses and manual filament changes. Machine print duration is not automatically hands-on labor.
Live Excel example · edit inputs and see results
Blue cells are editable. Results recalculate as you type. Each example is a separate sheet; percentages entered as inputs use whole numbers, such as 40 for 40%.
| A · Description | B · Value / result | Excel formula in B | |
|---|---|---|---|
| 1 | Hands-on minutes | Editable input | |
| 2 | Hourly rate ($) | Editable input | |
| 3 | Hands-on hours | =B1/60 | |
| 4 | Labor cost ($) | =B3*B2 |
Use these examples to learn the formula. They do not change your saved quote. Division by zero shows a message instead of a misleading number.
Printer depreciation
Depreciation per print = (Purchase price ÷ Rated life in hours) × Machine hours
TeX source
D_{\mathrm{print}}=\frac{P_{\mathrm{printer}}}{L_{\mathrm{hours}}}\,tWorked example: $800 ÷ 5,000 h × 4 h = $0.64.
This allocates the machine’s purchase price to printed work. In Reports, depreciation reduces book value; it is not an additional cash payment.
Live Excel example · edit inputs and see results
Blue cells are editable. Results recalculate as you type. Each example is a separate sheet; percentages entered as inputs use whole numbers, such as 40 for 40%.
| A · Description | B · Value / result | Excel formula in B | |
|---|---|---|---|
| 1 | Purchase price ($) | Editable input | |
| 2 | Rated life (hours) | Editable input | |
| 3 | Machine hours | Editable input | |
| 4 | Depreciation ($) | =IFERROR(B1/B2*B3,"Not defined") |
Use these examples to learn the formula. They do not change your saved quote. Division by zero shows a message instead of a misleading number.
Expected cost after failures
Success probability = 1 − Failure rate
Repeatable cost per success = Cost per attempt ÷ Success probability
Failure allowance = Repeatable cost per success − Cost per attempt
TeX source
p_{\mathrm{success}}=1-f \\ C_{\mathrm{success}}=\frac{C_{\mathrm{attempt}}}{1-f} \\ A_{\mathrm{failure}}=C_{\mathrm{success}}-C_{\mathrm{attempt}}Worked example: With a 10% failure rate, a $9 attempt costs $9 ÷ 0.90 = $10 per successful piece. The allowance is $1.
Use a fraction for failure rate: 10% = 0.10. The app applies this to repeatable costs, not the one-time model license and design allocation.
Live Excel example · edit inputs and see results
Blue cells are editable. Results recalculate as you type. Each example is a separate sheet; percentages entered as inputs use whole numbers, such as 40 for 40%.
| A · Description | B · Value / result | Excel formula in B | |
|---|---|---|---|
| 1 | Cost per attempt ($) | Editable input | |
| 2 | Failure rate (%) | Editable input | |
| 3 | Success probability | =1-B2/100 | |
| 4 | Cost per success ($) | =IFERROR(B1/B3,"Not defined") | |
| 5 | Failure allowance ($) | =B4-B1 |
Use these examples to learn the formula. They do not change your saved quote. Division by zero shows a message instead of a misleading number.
One-time license and design costs
One-time total = Model license + (Design hours × Design rate)
Allocation per piece = One-time total ÷ (Covered orders × Pieces per order)
TeX source
C_{\mathrm{once}}=C_{\mathrm{license}}+h_{\mathrm{design}}r_{\mathrm{design}} \\ A_{\mathrm{piece}}=\frac{C_{\mathrm{once}}}{n_{\mathrm{orders}}q}Worked example: A $100 one-time cost spread over 5 orders of 10 pieces adds $2 per piece.
If a model-cost percentage is entered, it takes precedence: allocation = one-time total × percentage ÷ quantity. With no percentage and zero covered orders, it is not added to the quote, but remains an initial investment in Reports.
Live Excel example · edit inputs and see results
Blue cells are editable. Results recalculate as you type. Each example is a separate sheet; percentages entered as inputs use whole numbers, such as 40 for 40%.
| A · Description | B · Value / result | Excel formula in B | |
|---|---|---|---|
| 1 | Model license ($) | Editable input | |
| 2 | Design hours | Editable input | |
| 3 | Design rate ($/hour) | Editable input | |
| 4 | Covered orders | Editable input | |
| 5 | Pieces per order | Editable input | |
| 6 | One-time total ($) | =B1+B2*B3 | |
| 7 | Allocation per piece ($) | =IFERROR(B6/(B4*B5),"Not allocated") |
Use these examples to learn the formula. They do not change your saved quote. Division by zero shows a message instead of a misleading number.
Price and profit
Expected unit cost
Unit cost = Repeatable cost per success + One-time allocation per piece
TeX source
C_{\mathrm{unit}}=C_{\mathrm{success}}+A_{\mathrm{piece}}Worked example: $10 of repeatable cost plus a $2 allocation gives a $12 expected cost per piece.
Repeatable costs include filament, setup waste, nozzle wear, electricity, printer depreciation, machine wear and labor. This is a modeled cost from your inputs.
Live Excel example · edit inputs and see results
Blue cells are editable. Results recalculate as you type. Each example is a separate sheet; percentages entered as inputs use whole numbers, such as 40 for 40%.
| A · Description | B · Value / result | Excel formula in B | |
|---|---|---|---|
| 1 | Repeatable cost per success ($) | Editable input | |
| 2 | One-time allocation per piece ($) | Editable input | |
| 3 | Expected unit cost ($) | =B1+B2 |
Use these examples to learn the formula. They do not change your saved quote. Division by zero shows a message instead of a misleading number.
Selling price for a target margin
Selling price = Unit cost ÷ (1 − Target margin)
TeX source
P=\frac{C_{\mathrm{unit}}}{1-m}Worked example: At a $10 cost and 40% target margin: $10 ÷ 0.60 = $16.666… before display rounding.
Use a fraction for margin: 40% = 0.40. Margin must be below 100%; the app caps its calculation at 99.9%.
Live Excel example · edit inputs and see results
Blue cells are editable. Results recalculate as you type. Each example is a separate sheet; percentages entered as inputs use whole numbers, such as 40 for 40%.
| A · Description | B · Value / result | Excel formula in B | |
|---|---|---|---|
| 1 | Unit cost ($) | Editable input | |
| 2 | Target margin (%) | Editable input | |
| 3 | Selling price ($) | =IFERROR(B1/(1-B2/100),"Not defined") |
Use these examples to learn the formula. They do not change your saved quote. Division by zero shows a message instead of a misleading number.
Profit and profit margin
Profit per piece = Selling price − Unit cost
Profit margin (%) = Profit per piece ÷ Selling price × 100
TeX source
\mathrm{Profit}=P-C_{\mathrm{unit}} \\ \mathrm{Margin}(\%)=\frac{\mathrm{Profit}}{P}\times100Worked example: Selling at $20 with a $12 cost leaves $8 profit. Margin = $8 ÷ $20 × 100 = 40%.
Margin is undefined when selling price is zero. The displayed profit is based on the modeled costs, not a guarantee of business net income.
Live Excel example · edit inputs and see results
Blue cells are editable. Results recalculate as you type. Each example is a separate sheet; percentages entered as inputs use whole numbers, such as 40 for 40%.
| A · Description | B · Value / result | Excel formula in B | |
|---|---|---|---|
| 1 | Unit cost ($) | Editable input | |
| 2 | Selling price ($) | Editable input | |
| 3 | Profit per piece ($) | =B2-B1 | |
| 4 | Profit margin | =IFERROR(B3/B2,"Not defined") |
Use these examples to learn the formula. They do not change your saved quote. Division by zero shows a message instead of a misleading number.
Markup is different from margin
Markup (%) = (Selling price − Unit cost) ÷ Unit cost × 100
TeX source
\mathrm{Markup}(\%)=\frac{P-C_{\mathrm{unit}}}{C_{\mathrm{unit}}}\times100Worked example: A $12 cost sold at $20 has a 66.7% markup and a 40% margin. A 40% markup on $12 gives a $16.80 price and only a 28.6% margin.
Markup divides by cost; margin divides by selling price. Markup is undefined when cost is zero.
Live Excel example · edit inputs and see results
Blue cells are editable. Results recalculate as you type. Each example is a separate sheet; percentages entered as inputs use whole numbers, such as 40 for 40%.
| A · Description | B · Value / result | Excel formula in B | |
|---|---|---|---|
| 1 | Unit cost ($) | Editable input | |
| 2 | Selling price ($) | Editable input | |
| 3 | Markup | =IFERROR((B2-B1)/B1,"Not defined") |
Use these examples to learn the formula. They do not change your saved quote. Division by zero shows a message instead of a misleading number.
Order revenue and profit
Order revenue = Unit selling price × Quantity + PREPAY freight
Order profit = Order revenue − (Unit cost excluding freight × Quantity + Freight)
TeX source
R=Pq+F \\ C_{\mathrm{order}}=C_{\mathrm{unit}}q+F \\ \mathrm{Order\ profit}=R-C_{\mathrm{order}}Worked example: 10 pieces at $20 each plus $15 freight give a $215 quote total. A $12 unit cost and $15 freight expense leave $80 profit.
The app rounds the whole order price when rounding is enabled, then derives unit price from that total. Rounding can change the actual margin. Freight is added once without markup; COLLECT and pickup add no freight charge. In these formulas, unit cost excludes freight.
Live Excel example · edit inputs and see results
Blue cells are editable. Results recalculate as you type. Each example is a separate sheet; percentages entered as inputs use whole numbers, such as 40 for 40%.
| A · Description | B · Value / result | Excel formula in B | |
|---|---|---|---|
| 1 | Unit selling price ($) | Editable input | |
| 2 | Unit cost excluding freight ($) | Editable input | |
| 3 | Quantity | Editable input | |
| 4 | PREPAY freight ($ per order) | Editable input | |
| 5 | Items subtotal ($) | =B1*B3 | |
| 6 | Quote total ($) | =B5+B4 | |
| 7 | Order cost including freight ($) | =B2*B3+B4 | |
| 8 | Order profit ($) | =B6-B7 |
Use these examples to learn the formula. They do not change your saved quote. Division by zero shows a message instead of a misleading number.
Cash, ROI and payback
Initial investment and net cash
Initial investment = Printer purchase + Model/design cost + Other one-time cost
Monthly net cash = Monthly revenue − Monthly cash costs
TeX source
I=P_{\mathrm{printer}}+C_{\mathrm{model/design}}+C_{\mathrm{other}} \\ N_t=R_t-C_{\mathrm{cash},t}Worked example: An $800 printer plus $100 of model/design costs and $100 of other one-time costs starts with a $1,000 investment.
Reports pays these costs at month 0. Depreciation is excluded from monthly cash costs, so the printer purchase is not paid a second time.
Live Excel example · edit inputs and see results
Blue cells are editable. Results recalculate as you type. Each example is a separate sheet; percentages entered as inputs use whole numbers, such as 40 for 40%.
| A · Description | B · Value / result | Excel formula in B | |
|---|---|---|---|
| 1 | Printer purchase ($) | Editable input | |
| 2 | Model/design cost ($) | Editable input | |
| 3 | Other one-time cost ($) | Editable input | |
| 4 | Initial investment ($) | =SUM(B1,B2,B3) | |
| 5 | Monthly revenue ($) | Editable input | |
| 6 | Monthly cash costs ($) | Editable input | |
| 7 | Monthly net cash ($) | =B5-B6 |
Use these examples to learn the formula. They do not change your saved quote. Division by zero shows a message instead of a misleading number.
Cash position and ROI
Cash position = −Initial investment + Sum of monthly net cash
ROI (%) = Cash position ÷ Initial investment × 100
TeX source
K_T=-I+\sum_{t=1}^{T}N_t \\ \mathrm{ROI}(\%)=\frac{K_T}{I}\times100Worked example: Start with $1,000 and earn $1,200 in cumulative net cash. Cash position is +$200 and ROI is 20%.
This is the Reports convention: ROI starts at −100% and reaches 0% at payback. It is not an annualized rate. With zero initial investment, the app shows ROI as not available. The live sheet holds monthly net cash constant; Reports calculates each month separately.
Live Excel example · edit inputs and see results
Blue cells are editable. Results recalculate as you type. Each example is a separate sheet; percentages entered as inputs use whole numbers, such as 40 for 40%.
| A · Description | B · Value / result | Excel formula in B | |
|---|---|---|---|
| 1 | Initial investment ($) | Editable input | |
| 2 | Monthly net cash ($) | Editable input | |
| 3 | Months elapsed | Editable input | |
| 4 | Cumulative net cash ($) | =B2*B3 | |
| 5 | Cash position ($) | =-B1+B4 | |
| 6 | ROI | =IFERROR(B5/B1,"Not available") |
Use these examples to learn the formula. They do not change your saved quote. Division by zero shows a message instead of a misleading number.
Payback period
For constant positive monthly net cash:
Payback months = Initial investment ÷ Monthly net cash
TeX source
T_{\mathrm{payback}}=\frac{I}{N},\quad N>0Worked example: A $1,000 investment earning $200 net cash per month pays back in 5 months. After 6 months, cash is +$200 and ROI is 20%.
The report uses actual modeled monthly cash, not this constant-cash shortcut. It finds the first zero crossing and interpolates within that month. If cash never reaches zero in the chosen horizon, payback is not within the horizon.
Live Excel example · edit inputs and see results
Blue cells are editable. Results recalculate as you type. Each example is a separate sheet; percentages entered as inputs use whole numbers, such as 40 for 40%.
| A · Description | B · Value / result | Excel formula in B | |
|---|---|---|---|
| 1 | Initial investment ($) | Editable input | |
| 2 | Monthly net cash ($) | Editable input | |
| 3 | Payback months | =IF(B1=0,0,IF(B2>0,B1/B2,"Not reached")) |
Use these examples to learn the formula. They do not change your saved quote. Division by zero shows a message instead of a misleading number.
Remaining book value
Book value = Purchase price − Cumulative depreciation
TeX source
V=\max\!\left(0,P_{\mathrm{printer}}-\sum D\right)Worked example: An $800 printer with $200 of accumulated depreciation has a $600 remaining book value.
Reports caps depreciation so book value cannot go below zero. Zero rated lifetime disables depreciation and lifetime capacity capping in the report.
Live Excel example · edit inputs and see results
Blue cells are editable. Results recalculate as you type. Each example is a separate sheet; percentages entered as inputs use whole numbers, such as 40 for 40%.
| A · Description | B · Value / result | Excel formula in B | |
|---|---|---|---|
| 1 | Purchase price ($) | Editable input | |
| 2 | Cumulative depreciation ($) | Editable input | |
| 3 | Remaining book value ($) | =MAX(0,B1-B2) |
Use these examples to learn the formula. They do not change your saved quote. Division by zero shows a message instead of a misleading number.
Change log (5 entries)
- Version 1.4
Replaced Greek profit symbols with explicit Profit and Quote profit labels in formulas.
- Version 1.3
Added WolframAlpha links using live inputs and increased equation, explanation and spreadsheet text sizes. Tightened image frames and spacing while retaining full-size enlargement.
- Version 1.2
Typeset formulas in TeX and added live Excel examples with editable inputs, cell formulas, results and copying to Excel.
- Version 1.1
Expanded the article layout to use the full available page width.
- Version 1.0
Started change tracking for the current article. This version includes structured guidance, topic tags, app screenshots, formulas and worked examples, interactive examples.
Did this article solve your problem?
Loading feedback…